Diagram template
Adoption lifecycle
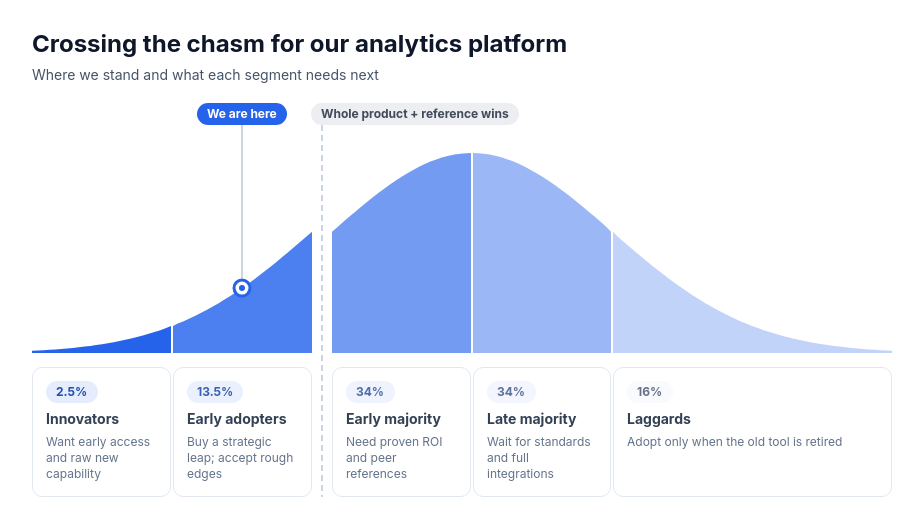
Rogers' adoption curve drawn as a true normal bell split at its standard deviations into five filled adopter segments with their fixed population shares, an optional gap between early adopters and the early majority with a chasm note, an optional marker for where the subject stands, and a measured caption card under each segment.
Categories
Included in
Power, Max
When to use it
Use to place a product, technology, internal tool, policy, practice or service on the diffusion of innovations curve: go-to-market planning for a B2B product, rollout of a new internal platform, adoption of a public-health practice, or spread of a teaching method. Describes what each adopter group needs and where the subject stands now. Shares are Rogers' fixed model values, not measured data. Not for supplied measured distributions, funnels, sequential stages or other bell-shaped data.
Adjust after generating
Change the style, colors, and font, and these options, as often as you like without spending credits.
- Card shape
- Card fill
- Color distribution
- Card border
- Card shadow
- Typography
- Spacing
- Alignment
- Material
What you fill in
Describe your topic in plain words and the AI fills these in. You can edit every field afterwards.
- Segments
- Exactly 5, each with optional name and optional description
- Chasm
- Text
- Highlight
- Segment and label
Related templates
All framework templates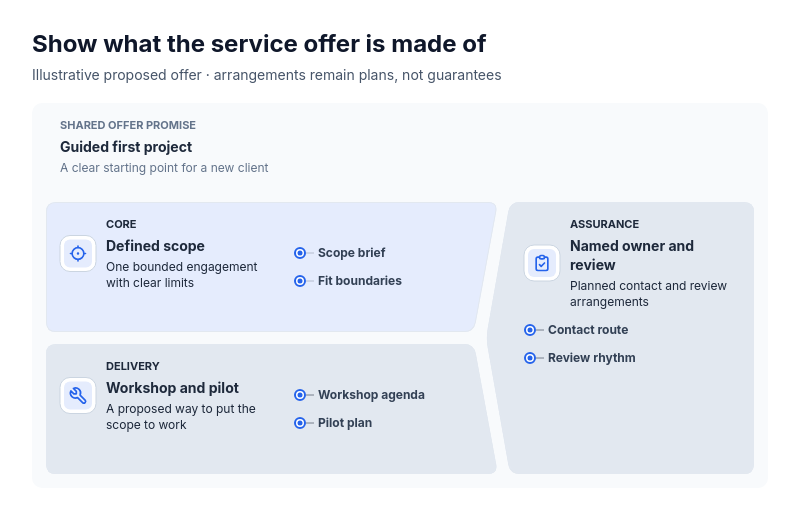 Anatomy: crowned subjectFor explaining what one thing is made of as a primary part, the part that carries it out and a part that spans both: a service offer (scope, delivery, assurance), a product (core function, how it ships, support), a course (content, format, learner support), an event (program, logistics, hosting) or a team charter (mission, ways of working, backing).
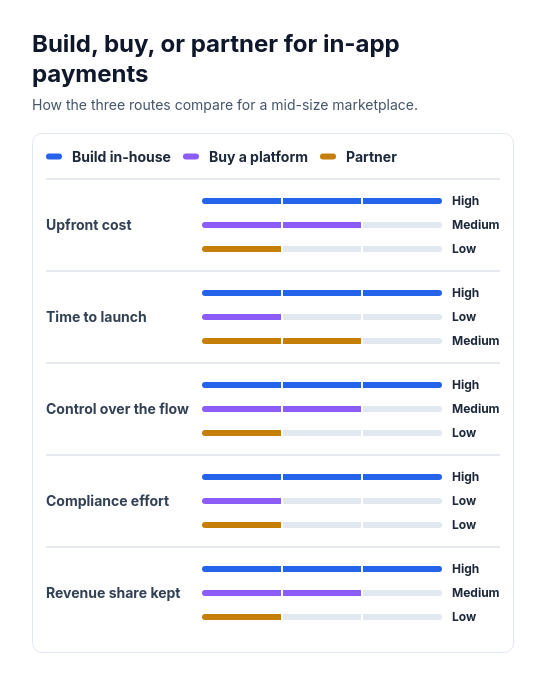 Attribute barsCompare two or three options across three to six attributes that can be scored or rated low, medium, or high, such as cost, speed, and effort.
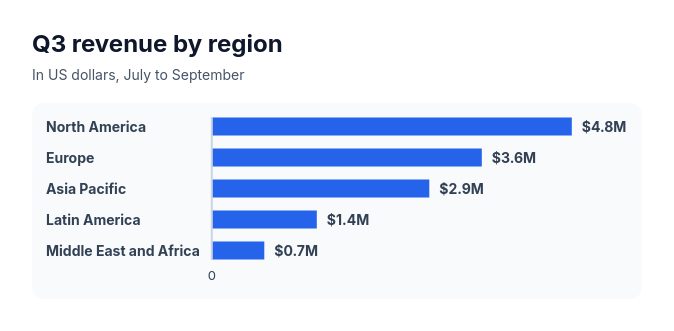 Bar chartCompare three to ten amounts of the same kind, such as sales by region, survey answers, or time per task.
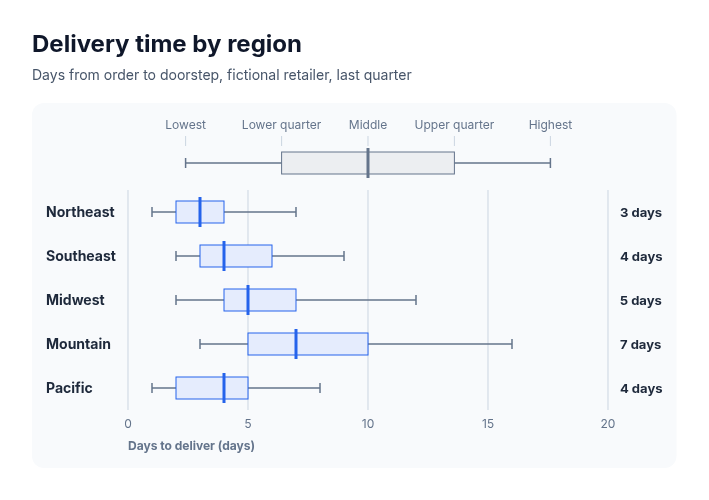 Box plotSuits comparing how values spread across groups when five summary numbers are known for each: delivery times by region, salaries by level, deal sizes by segment, response times by team, test scores by class.
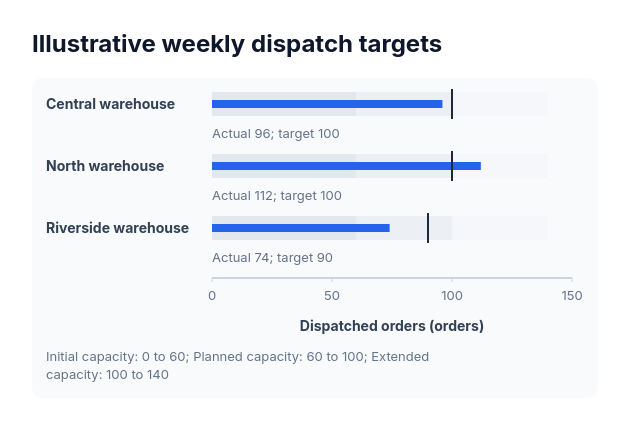 BulletActual-versus-target values sharing one nonnegative scale and explicitly supplied range boundaries.
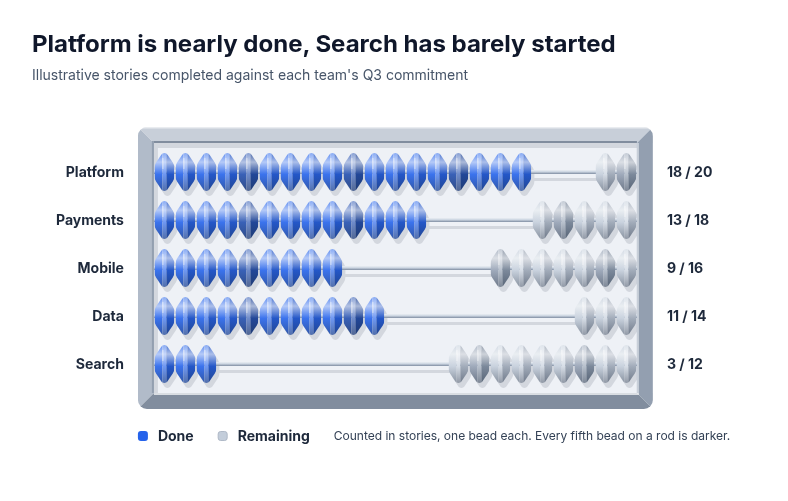 AbacusSuits small whole-number progress compared across a few rows, where each unit should stay countable: sprint or quota progress by team, seats filled by course, orders picked by warehouse, checklist items completed by site.