Diagram template
Box plot
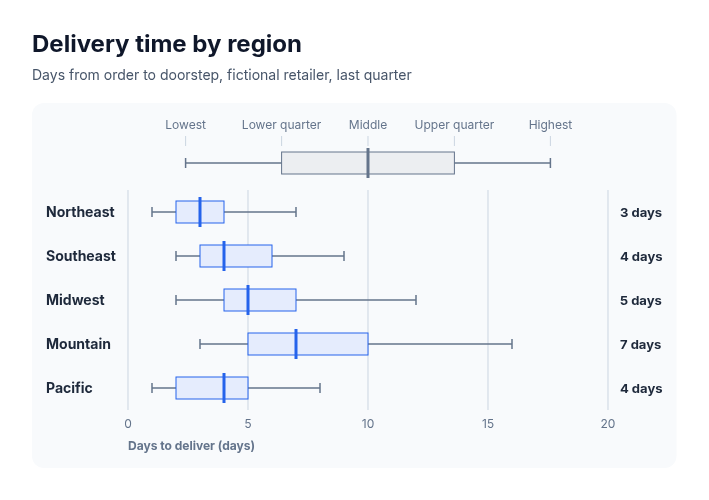
Three to seven named groups as horizontal rows on one shared numeric scale. Each row draws a whisker from its lowest to its highest value, a tinted box over its middle half and a strong mark at its median, with the median printed beside the row; a key row above labels the five parts in plain words.
Categories
Included in
Max
When to use it
Suits comparing how values spread across groups when five summary numbers are known for each: delivery times by region, salaries by level, deal sizes by segment, response times by team, test scores by class. Needs lowest, lower quartile, median, upper quartile and highest per group in one unit. Not for single values per group (use bars) or for one subject against peers on different metrics (use benchmark rows).
Adjust after generating
Change the style, colors, and font, and these options, as often as you like without spending credits.
- Typography
- Spacing
What you fill in
Describe your topic in plain words and the AI fills these in. You can edit every field afterwards.
- Value label
- Text
- Groups
- 3 to 7, each with name, start, lower quartile, median, upper quartile, and end
- Prefix
- Text
- Suffix
- Text
Related templates
All chart templates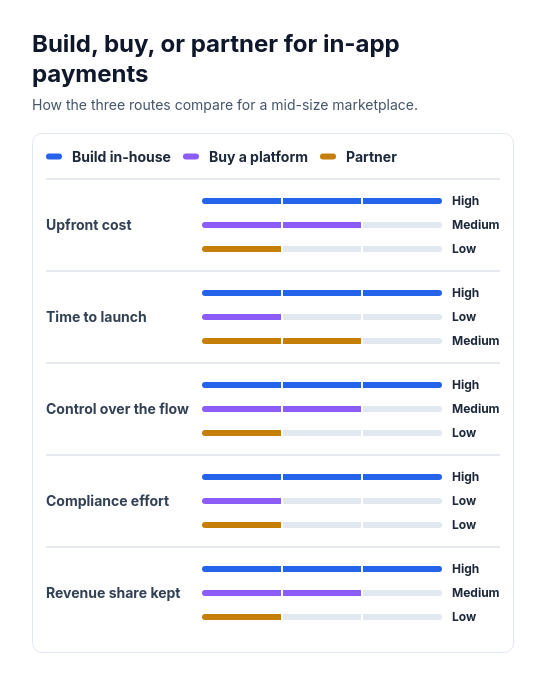 Attribute barsCompare two or three options across three to six attributes that can be scored or rated low, medium, or high, such as cost, speed, and effort.
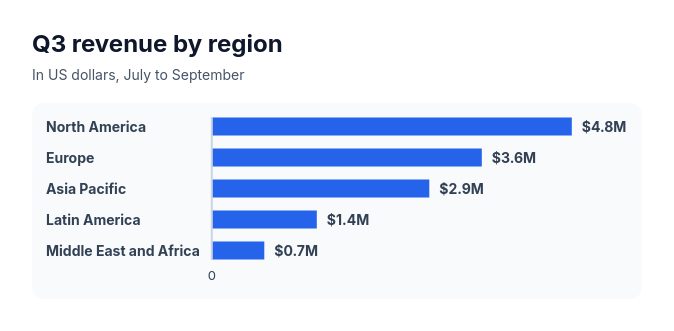 Bar chartCompare three to ten amounts of the same kind, such as sales by region, survey answers, or time per task.
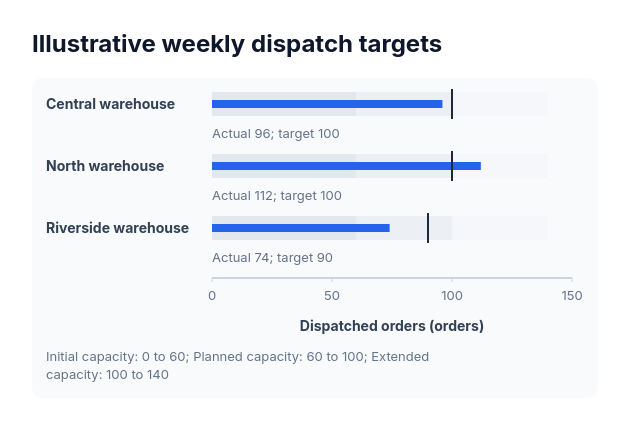 BulletActual-versus-target values sharing one nonnegative scale and explicitly supplied range boundaries.
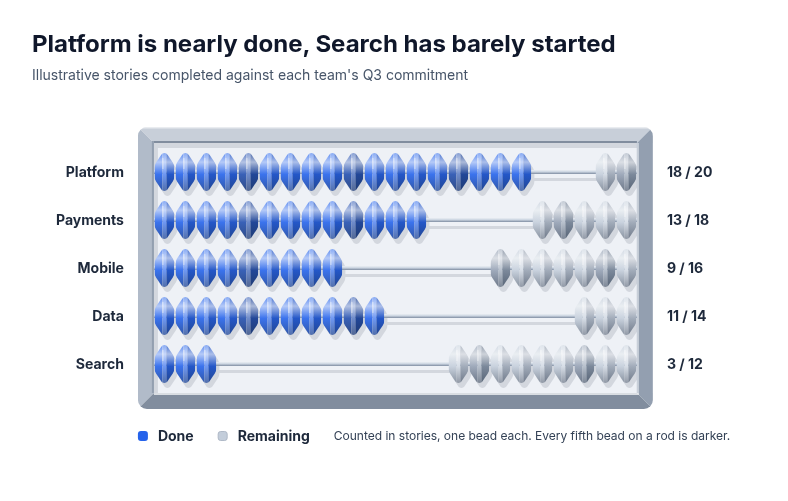 AbacusSuits small whole-number progress compared across a few rows, where each unit should stay countable: sprint or quota progress by team, seats filled by course, orders picked by warehouse, checklist items completed by site.
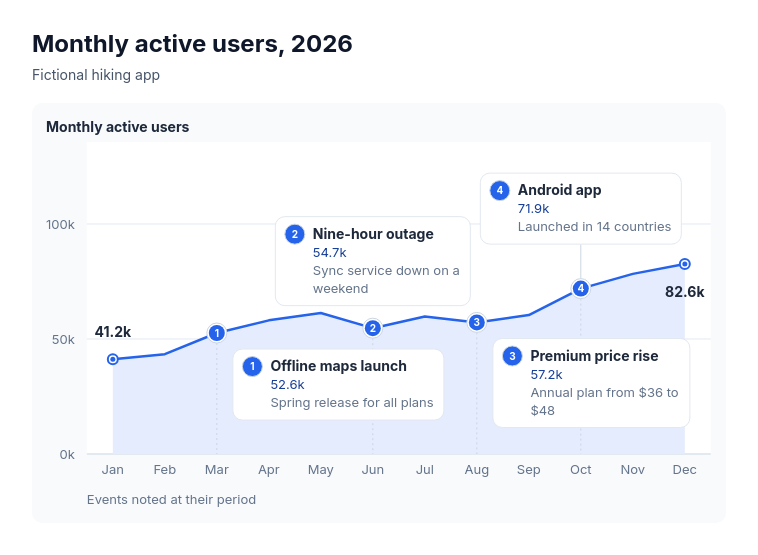 Annotated lineSuits explaining the turns in one measure over time: monthly active users with launches and outages, revenue with pricing changes, support volume with policy changes, website traffic with campaigns, headcount with reorganisations.
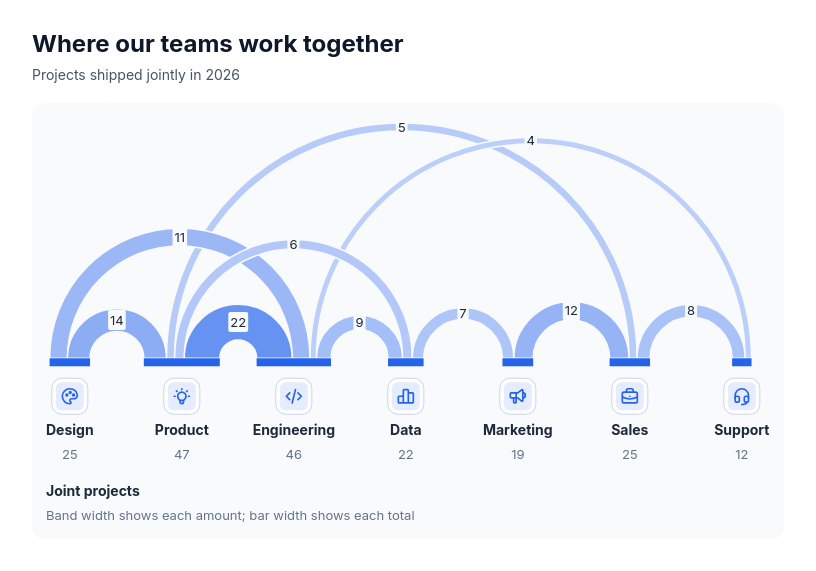 Chart: arc diagramShow how much pairs of participants share, and who is most connected, when order along a line helps: joint projects between teams, referrals between channels, cross-sell between products, trade between regions, co-authorship between groups.