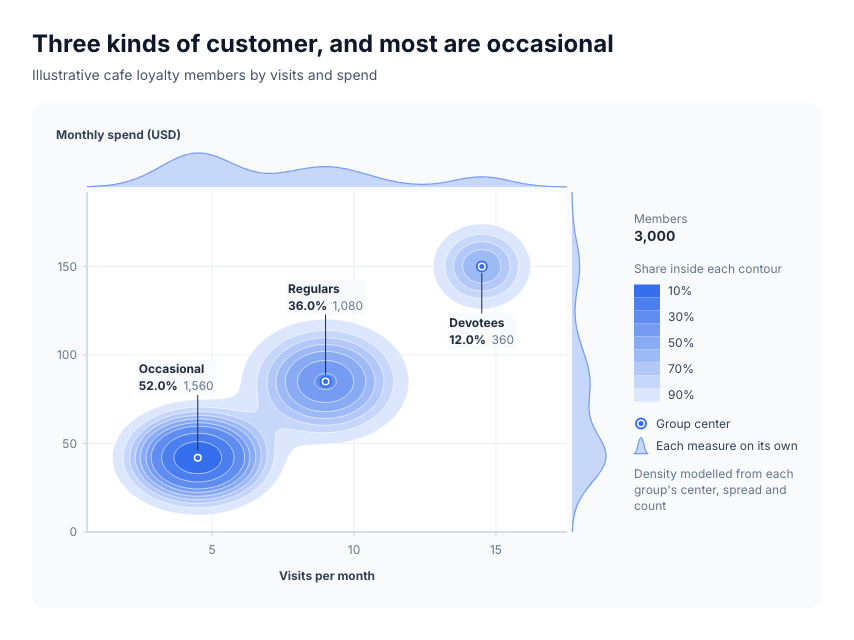
Diagram template
Density plot
Two to five groups of observations on two numeric axes, drawn as a topographic map of where the observations sit: smooth nested contour bands traced from the summed density of the groups, tinted in one hue from pale lowland to deep summit. Each contour encloses a stated share of all observations, so hills that merge, stand apart or rise higher are read directly. Every group's center carries a marker with its name, derived share and count, and a stepped key gives the share enclosed by each band.
Categories
Included in
Max
When to use it
Suits many observations that cluster on two measures: customers by visits and spend, deals by size and cycle length, sessions by duration and pages, employees by tenure and pay. Needs each group's center, spread on both axes and count; the density is modelled from those summaries, not from raw points, and says so. It shows how many clusters there are, how big, how concentrated and how far apart; use a scatter plot for a handful of named observations, and a histogram or ridgeline for one measure.
What you fill in
Describe your topic in plain words and the AI fills these in. You can edit every field afterwards.
- X axis
- Label and optional unit
- Y axis
- Label and optional unit
- Count label
- Text
- Groups
- 2 to 5, each with name, x, y, width, height, and count
Related templates
All chart templates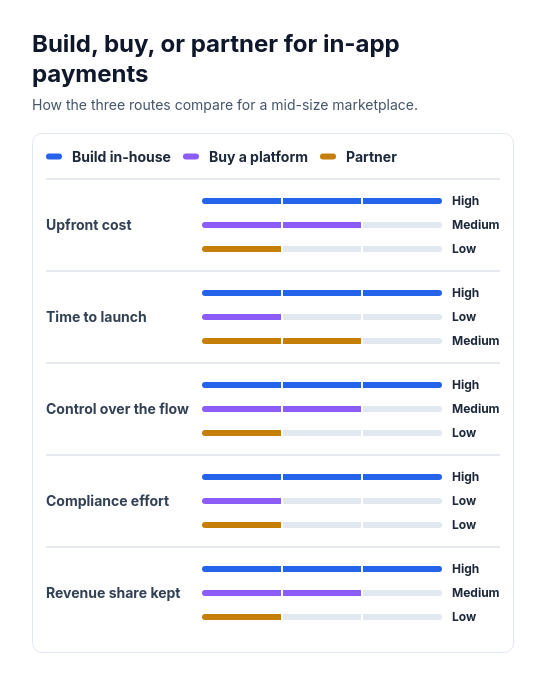 Attribute barsCompare two or three options across three to six attributes that can be scored or rated low, medium, or high, such as cost, speed, and effort.
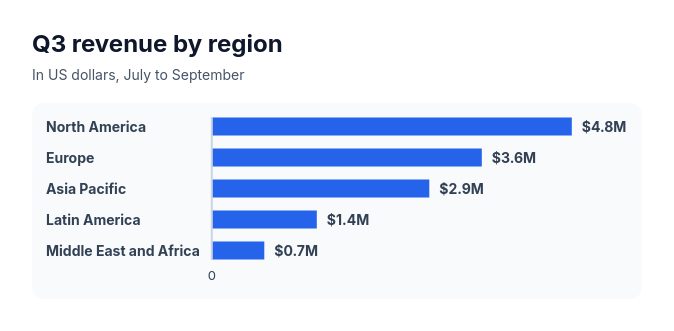 Bar chartCompare three to ten amounts of the same kind, such as sales by region, survey answers, or time per task.
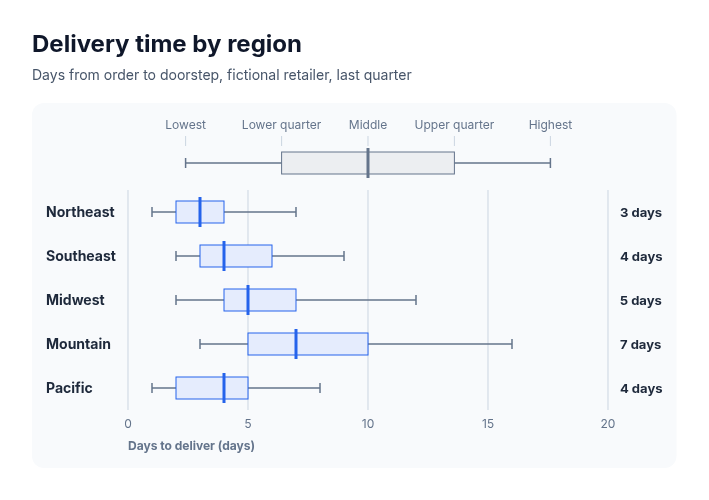 Box plotSuits comparing how values spread across groups when five summary numbers are known for each: delivery times by region, salaries by level, deal sizes by segment, response times by team, test scores by class.
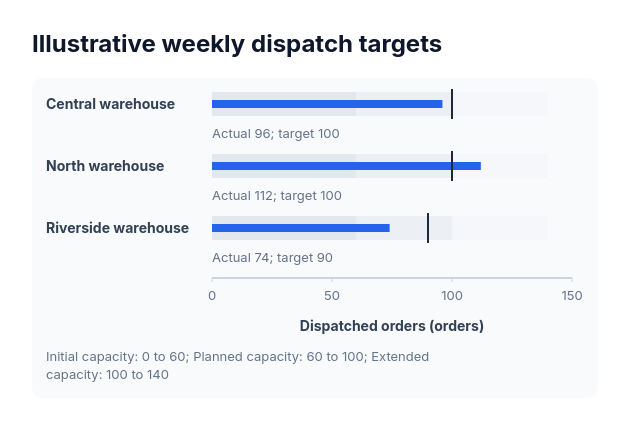 BulletActual-versus-target values sharing one nonnegative scale and explicitly supplied range boundaries.
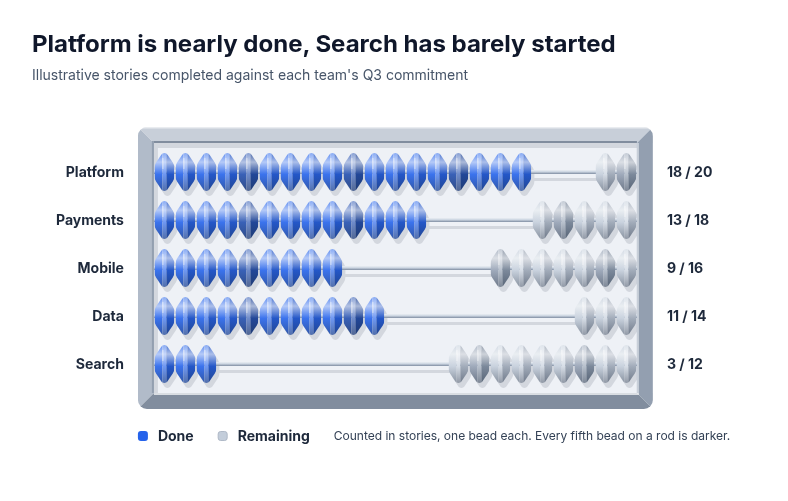 AbacusSuits small whole-number progress compared across a few rows, where each unit should stay countable: sprint or quota progress by team, seats filled by course, orders picked by warehouse, checklist items completed by site.
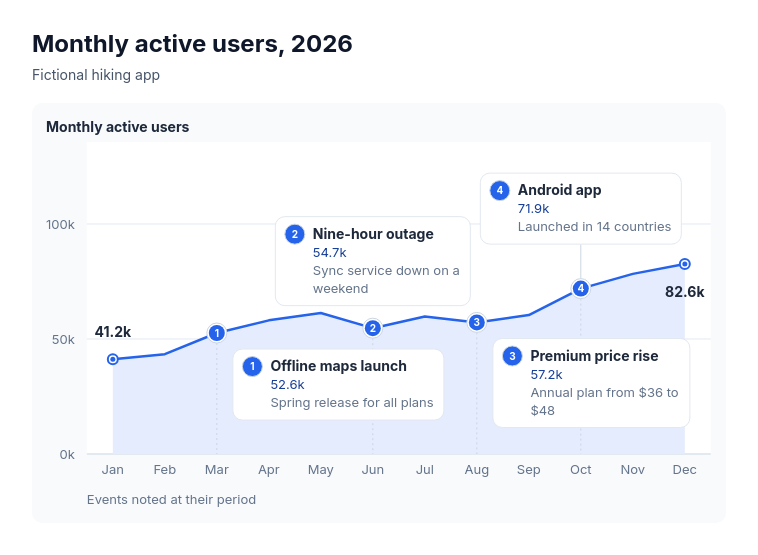 Annotated lineSuits explaining the turns in one measure over time: monthly active users with launches and outages, revenue with pricing changes, support volume with policy changes, website traffic with campaigns, headcount with reorganisations.