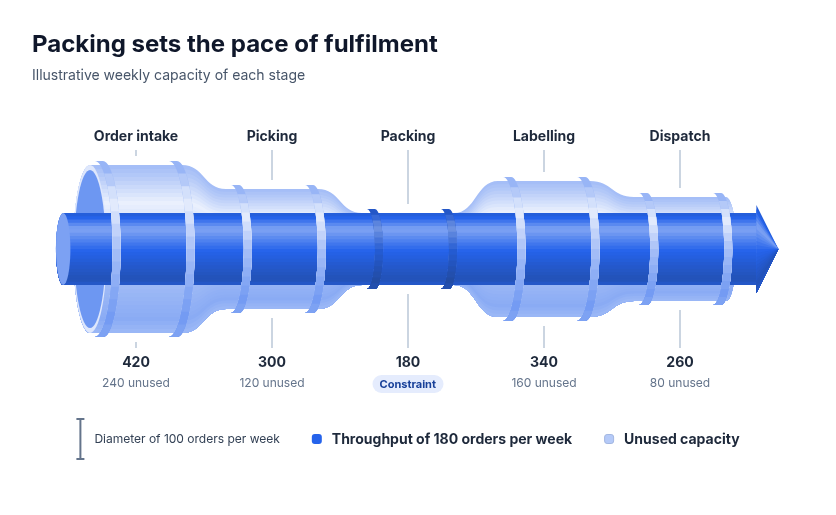
Diagram template
Capacity pipe
Four to six ordered stages drawn as one continuous lit round pipe, its diameter at each stage exactly proportional to that stage's supplied capacity on one zero-based scale, with flared reducers and collars between stages and an open end showing the wall. A solid core stream as wide as the narrowest stage runs the whole length, so the pale shell around it is the capacity each wider stage leaves unused; the narrowest stage is filled by the core and marked as the constraint. Stage names sit above, capacities and derived unused amounts below, with a diameter scale and key.
Categories
Included in
Max
When to use it
Suits a line of stages whose throughput is set by its tightest stage when the capacities are known: order fulfilment, a manufacturing line, a hiring pipeline, a data pipeline, a support queue, a release process. Needs one positive capacity per stage in one unit. It shows where the constraint is and how much capacity elsewhere goes unused, not how many items survive each stage: use a funnel for narrowing counts and a schematic bottleneck when no capacities are supplied. Not for branching or parallel flows.
What you fill in
Describe your topic in plain words and the AI fills these in. You can edit every field afterwards.
- Unit
- Text
- Stages
- 4 to 6, each with title and capacity
Related templates
All process templates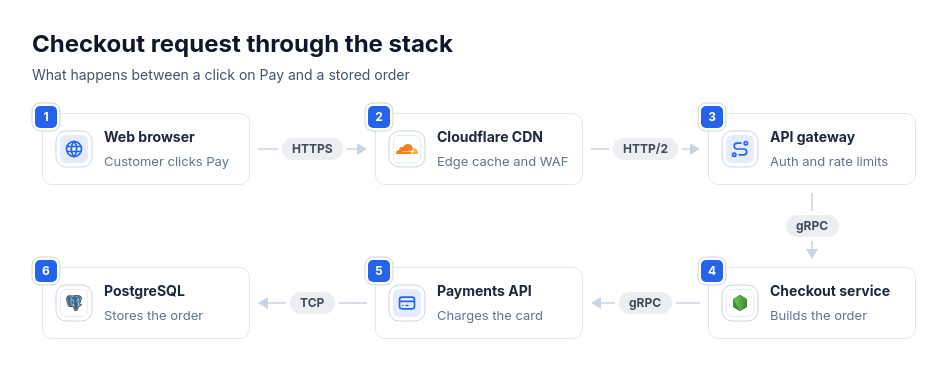 Architecture: request pathThree to eight hops of one request in order, such as a request through CDN, gateway, services, and database, an auth or checkout request trace, or a webhook delivery path, optionally with the protocol or measured time of each link.
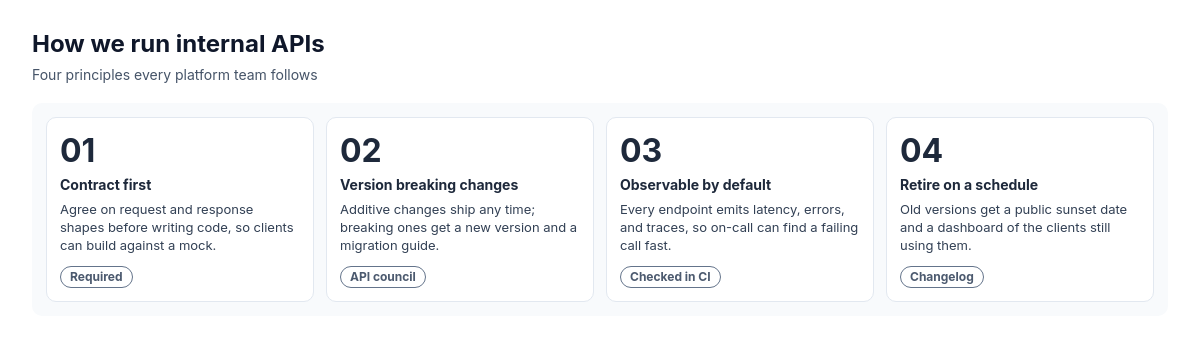 Numbered takeaways with optional footnotesParallel principles or takeaways.
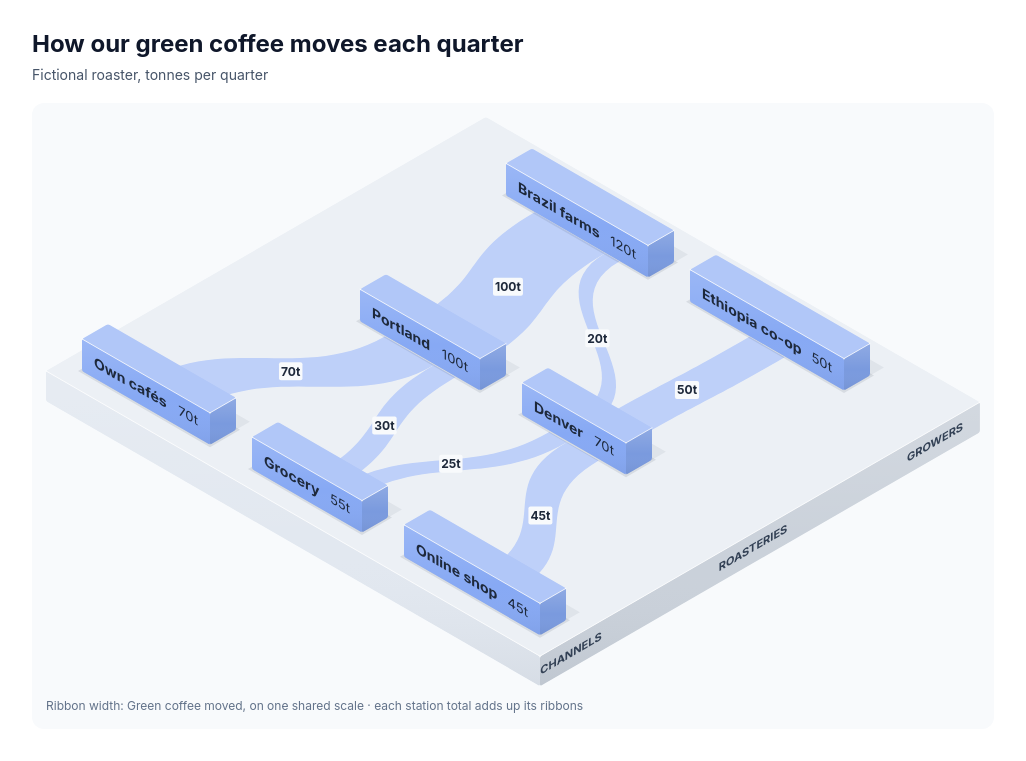 Chart: isometric station platforms in stage columnsOne measured quantity moving through a chain of stages where every middle station passes on exactly what it receives: supply chain volumes from suppliers through plants to stores, data moving between systems in a pipeline, students moving from intake routes through programmes into destinations.
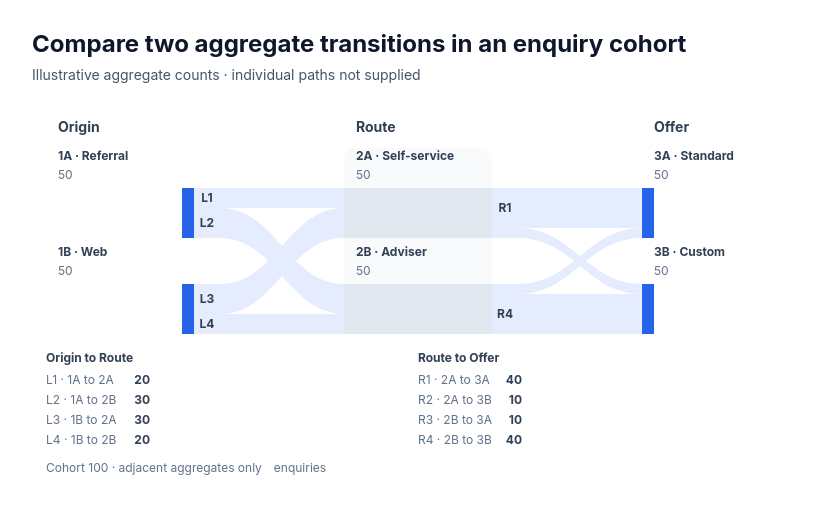 Chart: adjacent aggregate transfersFor an explicitly closed conserved cohort classified into two categories at each of three ordered stages, with all eight adjacent pair counts including known zeros: enquiries by origin, route and offer; students by entry track, course and outcome; patients by referral, pathway and setting; or orders by channel, warehouse and carrier.
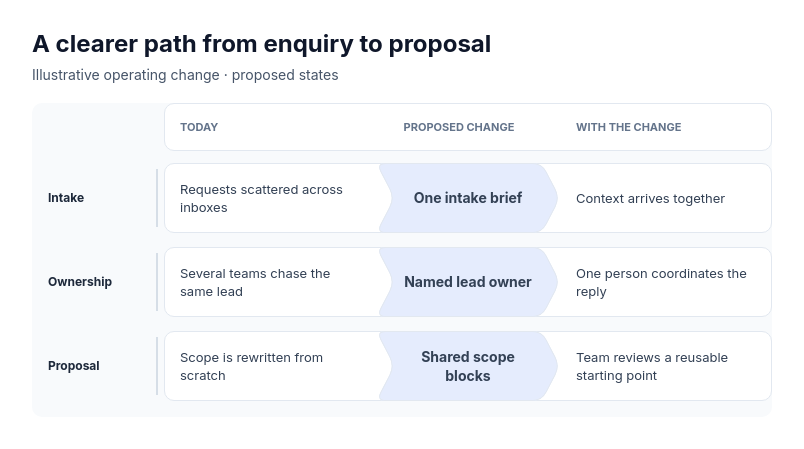 Comparison: paired statesFor proposals explaining which specific change connects each current condition to its proposed counterpart: a business process redesign, a product onboarding fix, a policy or classroom routine change, a team operating model, or a personal workflow.
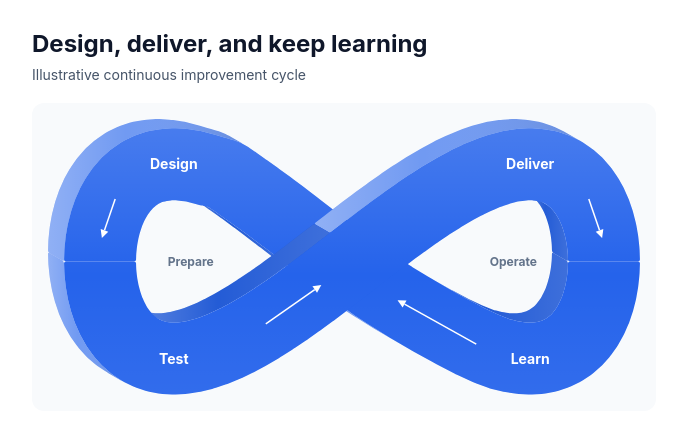 Cycle: dimensional infinityOne ordered four-stage process repeating through two phases, two stages per phase.