Diagram template
Comparison: vertical zipper
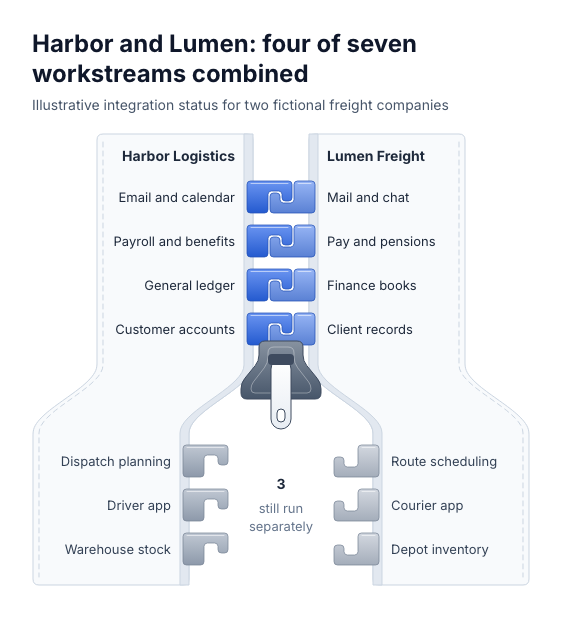
A vertical zipper whose two fabric tapes are the two named sides. Each row is one pair of counterparts, labelled on its tape beside a hooked tooth. Joined pairs interlock into one closed seam above the slider; below it the tapes curve apart and the remaining teeth face each other across an open gap that holds the derived count still open.
Categories
Included in
Max
When to use it
Use to show how far two sides have been joined pair by pair, such as the workstreams of a merger integration, a migration from an old system to a new one, feature parity between two products, or two teams adopting one process, with four to eight pairs of which at least one is joined and one still open. Joined pairs are listed first; the closed length is the count of joined pairs, not effort, value or time. Not for scored comparisons, pros and cons, timelines with dates, or pairs with partial progress.
Adjust after generating
Change the style, colors, and font, and these options, as often as you like without spending credits.
- Typography
- Spacing
What you fill in
Describe your topic in plain words and the AI fills these in. You can edit every field afterwards.
- Sides
- Exactly 2, each with name
- Remaining label
- Text
- Rows
- 4 to 8, each with left, right, and checked
Related templates
All comparison templates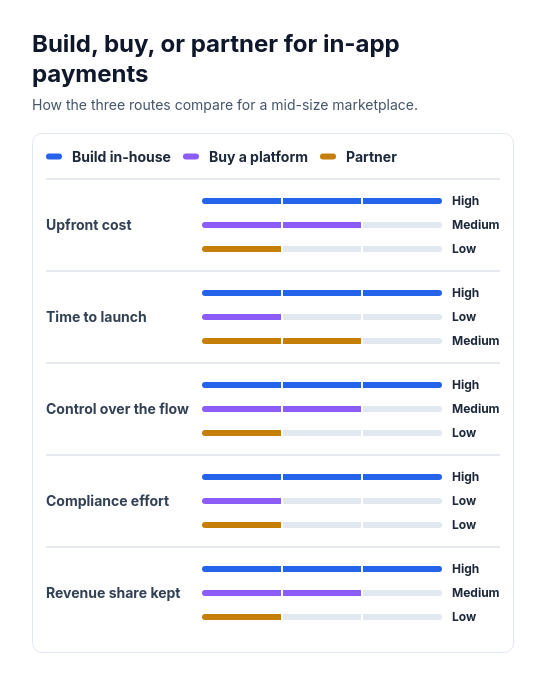 Attribute barsCompare two or three options across three to six attributes that can be scored or rated low, medium, or high, such as cost, speed, and effort.
 BenchmarkPlace one subject against a peer group's spread on two to eight metrics with different units: company or product benchmarks, a store or region against its network, salary or offer positioning against a market survey, a team or school against its organization.
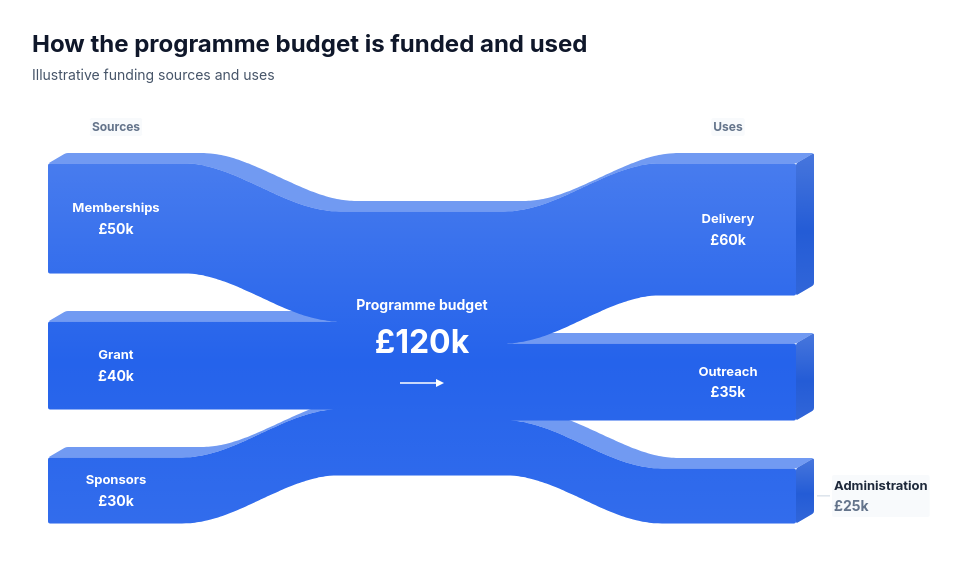 Conserved wholeTwo complete nonnegative marginal breakdowns of one positive common-unit total: funding sources and uses, staffing hours and work allocations, or energy supply and end uses.
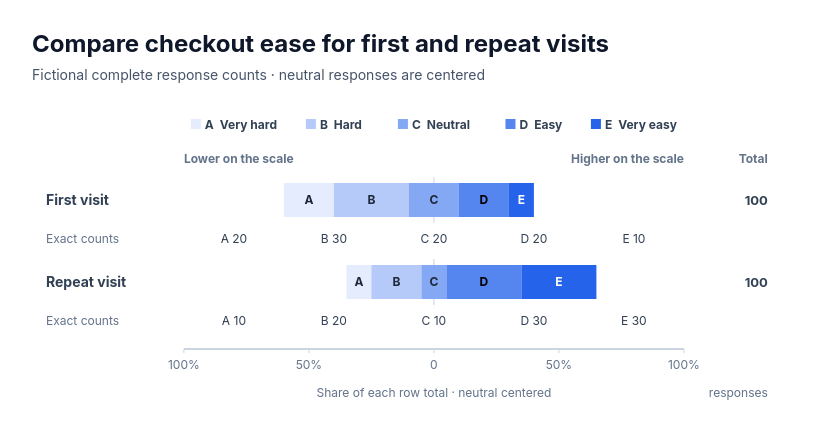 Chart: five-class ordered scaleFor complete supplied counts on one five-class ordered scale compared across two or three groups: survey agreement by segment, review star ratings by product, risk ratings by business unit, performance grades by team or difficulty ratings by release.
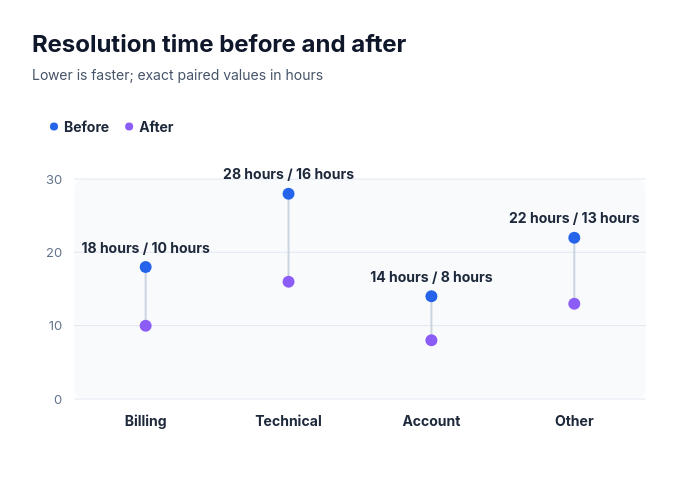 Dumbbell: vertical paired valuesCompare 2–8 paired signed finite before and after amounts as linked vertical points on one common axis.
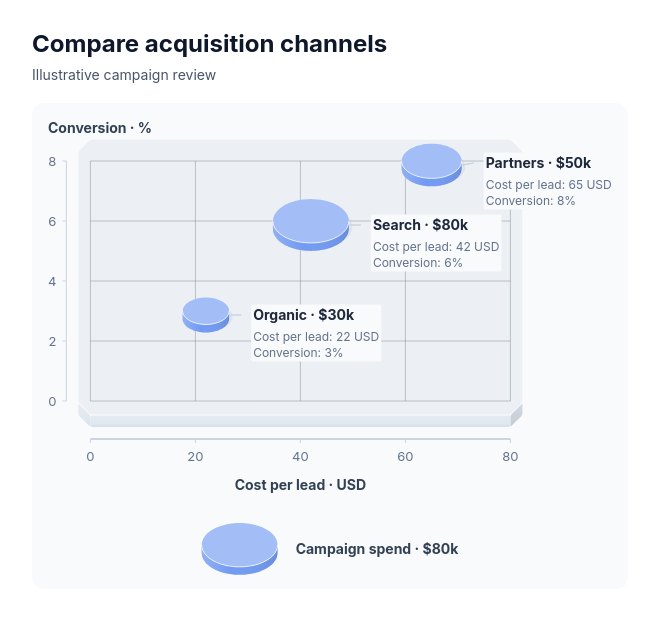 Bubble chartAcquisition channels by cost and conversion with spend, stores by traffic and sales with staffing, or products by growth and margin with revenue.